Wednesday, July 13, 2016

J Kumar Infraprojects Ltd


J Kumar Infraprojects Ltd


J Kumar Infra Porojects looks good at CMP to take long entry. This stock as well looking bullish as per our favorite set up. Stock took support at 200 Weekly EMA and 61.8 retracement of last raise while trending down in a channel ( Green lines). We also can see RSI +ve divergence on weekly charts marked with Red colored lines.

One can buy stock at CMP and hold with strong conviction to see minimum 61.8% retracement (~357) of this fall. Also we observed that BIRLA SUN LIFE ASSET MANAGEMENT COMPANY LIMITED made a bulk deal @ 236/- approximately.

We recommend a buy  with target price of 357 to 380.


Tuesday, July 12, 2016

PODDAR Developers

PODDAR Developers

PODDAR Developers looks good for long term. Stock made a huge move till mid of the year 2015. Its been into correction for almost an year now. Stock trying to take support near weekly 200 EMA and the way stock moved, it looks it can make a diagonal triangle pattern. Once stock breakout of the triangle stock can start moving upside once again. Buy the stock at CMP with SL below 700 for huge targets of 1500 - 1800.


Bharat Forge

BHARAT FORGE

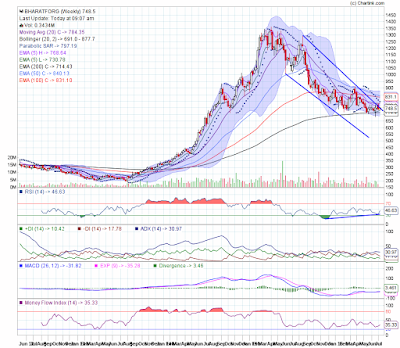
Bharat Forge looks in long term uptrend and have been into correction for almost a year or so. It is finding support near 200 Weekly EMA. One can buy the stock once it breakout of the downward trending channel show in image below or Else can buy at deeper if it corrects further towards lower channel. But it looks corrected enough and ready to move in this earning cycle. Stock also made hammer which shows strong buying signs and can see further upside from current levels.


Buy the stock with 1 year time horizon in mind to see the targets of 1100 -1110 and if stay at those levels then it can see previous high of 1363 levels.


Thursday, June 30, 2016

HERE is our DIWALI 2015 list of portfolio

Hi Good Evening Everyone,

Its glad to see many requests on my whats up number to understand our way of building portfolio and creation of wealth. Its also good to see that many people liked our trading calls.

Also few people are asking about our services and training details. Please drop your details in emails or post as a comment so that our team will get back to you with more details.

Here is the document with technical picture of stocks selected as part of our DIWALI 2015 portfolio.

We also give periodic reviews. Below are the snapshots of reviews we gave once in two months.

First Review


We gave second review recently. We are bound to give clear guidance and continuous support.


I wish you like it.


Sunday, January 24, 2016

Time to BUY PRIVATE BANK STOCKS

BANKNIFTY and BANK STOCKS

It's been an year the entire market is in down trend and correcting. Looking at weekly charts, it looks Banking sector is bottomed out around our favorite set up 200 WEEK EMA. Below charts shows that the market is taking support around 200 Week EMA and bouncing back with RSI Positive divergence.

We always suggest to be cautious when stocks are trading too away from 200 EMA ( either weekly or Daily) in our trainings and Technical reports with charts. Entire market and especially Banking sector was corrected for almost a year from the time it was away from 200 WEEK EMA. Now Banking sector is near 200 WEMA and also 61.8% retracement of previous raise. We are proud to say that this is our (Indorse Financials) favorite set up for positional trading.


We already took positions in Bank Nifty, ICICIBANK and AXIS BANK.
However few other Banking stocks like SBIN, BANK of BARODA also made doji in weekly charts. Be ready to take entries on breakout of these levels.

We, Indorse Financials feel that Indian markets completed corrective 4th wave and now ready for 5th wave upside. So be confident and be a buyer in markets.

Charts are below for Bank Nifty, AXIS BANK and ICICI BANK.

BANK NIFTY

BANK NIFTY made a piercing pattern on Weekly with a good close. Price moving above last week high may trigger a buy. So we suggest a strong buy for next 3.5 weeks with a target price of trend line shown in charts.


AXIS BANK 

AXIS BANK made a Bullish engulfing pattern in weekly charts. Many a times people struggle to make money in markets. We suggest with our reports and charts that simple things work great. We recommend a buy on AXIS BANK on moving above last weeks high with trend line as price target.


ICICI BANK

ICICI BANK made a piercing pattern on weekly chart same as Bank Nifty. We suggest a buy in stock with price target of upper Trend line.


There are many stocks with similar set up at this moment. Stocks like LT, BHEL, BANKBARODA, AMBUJACEM, eCLERX, NIFTY,NIFTYBEES and many more.... So BUY it and dont MISS.

Sunday, January 10, 2016

TARA JEWELS

TARA JEWELS

TARA JEWELS recently submitted a presentation to investors to attract explaining their Business model and market share along with sales, profit numbers. You can find it on BSE India website.

Looking at technical picture of the stock, Stock made a kind of Double bottom within 2 - 3 months time period. The strong formation of double bottom is expected to form in 4 to 6 months time frame. However it looks little lesser, the way stock moved till the reflection point with a good presentation by company to investors, having good business model with improving international market in Jewelry segment.

Stock touched earlier reflection point around 64 levels by making high of 67 and went into correction. Generally after a good pull back, if stock goes into correction, It will bounce back with in 4 weeks in trend changing moves. So lets see if stock crosses the recent high  of 67 to make an entry.

If you are a long term investor and can take the risk, one can take postion now at CMP or around 40 - 45 levels. If you can not take much risk and need a technical confirmation then wait for breakout of recent highs at 67.

We see targets of 108 - 120 where we have 200 Weekly EMA and previous cluster of resistances.
so buy the stock in recommended levels based on your ability of taking risk with SL below previous lows 30.

Disclosure: I have positions in stock which I took very recent and into mild profit.


VST Tiller Tractors

VST Tiller Tractors


VST Tiller Tractors consolidated for almost 1 year. Stock made life time in June 2014 and went into correction till Jan 2015. For 1 year stock traded around 50 WEMA. Stock is ready for breakout as seen in below chart. 

Below Weekly chart shows the MACD, RSI also ready to support the move. Price moving past Fridays high and trend line shown in below weekly chart, it can visit the previous highs of 1955. However 1700 seems to be immediate resistance on cross of trend line, Stock have potential to make highs once again. 

Recommended Buy on stock on crossing trend line around 1530 on Monday, hold for targets of 1700/1900/2000 with SL below 1355.

Disclosure: I have positions in the stock from much lower levels.